中国城市环境全要素生产率的估算及影响因素分析
VIP免费

浙江财经学院硕士学位论文
I
摘要
改革开放30年来,中国经济高速增长,城市化水平大幅提高,但是随之而来
的环境和生态问题也日益凸显,经济增长与环境污染间的关系已受到广泛关注。
全要素生产率提高是经济增长的核心,是一个区域经济发展质量提高、技术创新
与进步、效率改善的重要标志。当前追求“好”的经济发展不但要提高全要素生
产率对经济增长的贡献也必须充分考虑资源和环境对经济发展规模和速度的刚性
约束。所以,正确评价我国经济发展绩效,就必须在传统全要素生产率研究基础
上考虑到资源环境约束的影响。城市是各种要素空间集聚的产物,是区域经济增
长的核心地带,城市的环境全要素生产率是衡量我国城市发展水平的非常重要的
经济绩效指标,不但可以直接反映环境约束下各城市经济发展的总体状况,也为
解释我国城市发展的区域差异提供线索。本文拟通过对我国230个地级以上城市的
环境全要素生产率的变化来解决以下问题:我国城市环境全要素生产率及其增长
的总体状况如何?与不考虑环境约束时有何差异?TFP增长的源泉是什么?城市
TFP增长对城市经济增长的贡献如何?我国城市TFP的区域差异如何表现?不同级
别城市的TFP增长差异如何?以及城市TFP的影响因素是什么?
为了解决上述问题,本文在全要素生产率理论基础上,运用
Malmquist-Luenberger 指数方法(简称ML指数)测度了中国230个地级以上城市
2003—2010年间城市的环境全要素生产率及其分解,分别从我国城市总体变化、
四大板块间的区域差异、我国主要的三大城市群及主要城市差异对比三大角度全
方位分析了我国城市的环境全要素生产率,最后就影响城市环境全要素生产率增
长的因素进行了实证研究。得出如下结论:
(1)我国城市环境全要素生产率总体上呈上升趋势,对同期城市经济增长的
贡献为21.18%;城市环境全要素生产率的提高主要得益于技术进步,技术进步的
“增长效应”显著,但明显缺乏效率提升的“水平效应”;考虑环境约束后城市
的全要素生产率高于传统的全要素生产率,可能是最近几年我国的生产技术环保
性有所提高。
(2)四大板块的ML指数、效率改进指数和技术进步指数的变化趋势具有一致
性,都反映出环境全要素生产率水平提高、技术进步明显但效率水平下降的特征。
东部地区的城市全要素生产率增长最快,其次是东北部城市,中部和西部排名最
后且低于全国平均水平,城市发展的区域差异明显。中西部内陆区域城市无论是
传统的全要素生产率还是环境全要素生产率的增长率均低于东部沿海地区,即出
现了中国区域经济发展中的“双重恶化”。
浙江财经学院硕士学位论文
II
(3)三大城市群在2003-2010年间生产率均不断提高,生产率增长率最高的
是京津冀城市群,其次是珠三角城市群,长三角城市群年均增长率最低,且低于
全国的平均水平。三大城市群的首位城市兼核心城市北京、上海、广州的环境全
要素生产率在样本期间均保持了持续高速增长,三城市中只有上海是技术进步和
效率改善双重效果共同推进环境全要素生产率的提高;北京、广州的生产率提高
则来源于技术进步,效率变化完全起“拖累”作用。其余的20个省会及副省会城
市的ML均值及累积变化值均低于15个重点城市,剩余的195个城市的生产率增长率
最低,处于全国平均水平以下,说明我国各级城市生产率水平差异较大,如何大
力发展中小城市是我国未来城市发展的方向。
(4)本文最后采用面板数据考察了影响城市环境全要素生产率增长的因素,发
现环境全要素生产率支持“库兹涅茨曲线假说”及“污染天堂假说”。禀赋结构、
科学技术投入、企业的环境管理能力均对对环境全要素生产率有正面影响。
关键词: 环境管制;环境全要素生产率;方向性距离函数;
Malmquist-Luenberger生产率指数;城市群
浙江财经学院硕士学位论文
III
ABSTRACT
After 30 year’s reform and opening up, China has experienced rapid economic
development and a substantial increase in the level of urbanization, but the accompanied
environmental and ecological problems are becoming increasingly prominent. Total
Factor Productivity (TFP) is the core of economic growth and an important symbol of
the improvement of regional economic development quality, efficiency, technological
innovation and progress. The pursuit of "good" economic development should not only
improve TFP contribution to economic growth but also fully consider the rigid
constraints of resources and environment on economic development scale and
speed .Therefore, the correct evaluation of China's economic development performance,
must be in the traditional study on total factor productivity based on considering the
restriction of resource and environment impact .City is the product of a variety of
elements spatial agglomeration and the core of the regional economic growth . City
environmental total factor productivity is the measure of our city development level of
very important economic performance indicators, which can not only directly reflect
each city’s overall development situation, but also can provide clues to explain the
regional differences in the development of our country cities .Through 230
prefecture-level cities’ changes of environmental total factor productivity, this article is
to solve the following problems: how is environmental total factor productivity of China
cities change? And what differences exists compared to TFP without considering the
environmental constraints? What are the sources of city TFP growth? What are the
differences among TFP growth of different levels of city? What factors will have
impacts on city TFP?
In order to solve the above problems, based on the theory of total factor
productivity , this paper using Malmquist-Luenberger index (ML index) measures the
Chinese 230 prefecture-level cities’ Environmental Total Factor Productivity and its
decomposition during 2003-2010 years, and respectively from overall changes of our
country city, four large plates and the three big city groups comprehensively analyzes
our country city environmental total factor productivity, then analyzes the influence
factors of city environmental total factor productivity and finally draw the following
conclusions:
(1) Our country city environmental total factor productivity show ascendant trend
on the whole, which contributed 21.18% to the economic growth; the increase of city
浙江财经学院硕士学位论文
IV
environmental total factor productivity is mainly due to the technological progress.
"Growth effect" of technical progress is significant, while "horizontal effect" of
efficiency promotion don’t exist. Environmental total factor productivity is higher than
that of the traditional total factor productivity.
(2) The change trend of ML index, efficiency index and technological progress
index of four plates are in consistency, all reflect the characteristics of great increase of
environmental total factor productivity level and technology progress, and the decrease
of efficiency. Total factor productivity growth of eastern part of the city increase most
quickly, followed by the northeast city, central and western areas last, lower than the
national average. Whether traditional total factor productivity or environmental total
factor productivity growth rates of midland and western area city are both lower than
the eastern coastal areas, which means the regional economic development in China is
in "double deterioration".
(3) Three city groups’ productivity during 2003-2010 year keep rising, the highest
productivity growth rates is in Jing-Jin-Ji city group, followed by the Pearl River Delta
city group, Yangtze River Delta city group last, and lower than the average level of the
whole nation. The first city of each city group Beijing, Shanghai, Guangzhou, their
environmental total factor productivity during the sample period are maintained a
sustained rapid growth, of three city Shanghai is the only one which environmental total
factor productivity growth is jointly promoted by technical progress and efficiency
improvement ; Beijing, Guangzhou productivity growth originate technical progress,
while efficiency change completely "drag". The rest of the 20 provincial capitals and
vice provincial cities’ ML average and cumulative change were lower than 15 focus city,
the remaining 195 city productivity growth rate was the lowest. This conclusion
explains the differences of all levels of city productivity level, and realizes that how to
develop medium and small cities is the future development direction.
(4) Finally, panel data were used to investigate the influence factors of city
environmental total factor productivity growth, environmental total factor productivity
support “Kuznets Curve Hypothesis" and "Pollution Haven Hypothesis". Endowment
structures, investment in science and technology, enterprise environment management
capabilities all have positive influences on the environmental total factor productivity.
Keywords: Environmental Regulation; Environmental Total Factor Productivity;
Directional Distance Function; Malmquist—Luenberger Productivity Index;
City Group
浙江财经学院硕士学位论文
V
目录
第1章 导言 .................................................................................................................... 1
1.1 研究背景 ............................................................................................................. 1
1.2 研究意义 ............................................................................................................ 2
1.3 研架究框 ............................................................................................................ 4
1.4 研究方法 ............................................................................................................. 5
1.5 可能的创新和不足之处 .................................................................................... 5
第2章 全要素生产率相关研究的文献综述 ................................................................ 7
2.1 全要素生产率理论发展综述 ............................................................................. 7
2.2 不考虑环境约束的全要素生产率研究 ............................................................. 9
2.3 考虑环境约束的全要素生产率研究 ...............................................................11
第3章 城市环境全要素生产率的测算方法及数据选取 .......................................... 15
3.1 研究方法 ........................................................................................................... 15
3.2 变量选取及数据说明 ...................................................................................... 18
第4章 城市环境全要素生产率的比较分析 .............................................................. 21
4.1 城市环境全要素生产率的总体变化趋势 ...................................................... 21
4.2 城市环境全要素生产率的区域差异 .............................................................. 23
4.3 我国三大城市群环境全要素生产率对比分析 .............................................. 25
第5章 城市环境全要素生产率影响因素的回归分析 .............................................. 33
5.1 环境全要素生产率影响因素的相关研究 ....................................................... 33
5.2 城市环境全要素生产率影响因素的实证分析 ............................................... 33
第6章 结论与政策建议 .............................................................................................. 36
6.1 研究结论 ........................................................................................................... 36
6.2 政策建议 ........................................................................................................... 37
参考文献 ........................................................................................................................ 40
附录 ................................................................................................................................ 44
致谢 ................................................................................................................................ 45

摘要:
展开>>
收起<<
浙江财经学院硕士学位论文I摘要改革开放30年来,中国经济高速增长,城市化水平大幅提高,但是随之而来的环境和生态问题也日益凸显,经济增长与环境污染间的关系已受到广泛关注。全要素生产率提高是经济增长的核心,是一个区域经济发展质量提高、技术创新与进步、效率改善的重要标志。当前追求“好”的经济发展不但要提高全要素生产率对经济增长的贡献也必须充分考虑资源和环境对经济发展规模和速度的刚性约束。所以,正确评价我国经济发展绩效,就必须在传统全要素生产率研究基础上考虑到资源环境约束的影响。城市是各种要素空间集聚的产物,是区域经济增长的核心地带,城市的环境全要素生产率是衡量我国城市发展水平的非常重要的经济绩效指标...
相关推荐
-
七年级数学下册(易错30题专练)(沪教版)-第13章 相交线 平行线(原卷版)VIP免费
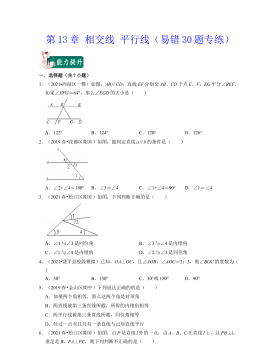
 2024-10-14 25
 -
七年级数学下册(易错30题专练)(沪教版)-第13章 相交线 平行线(解析版)VIP免费
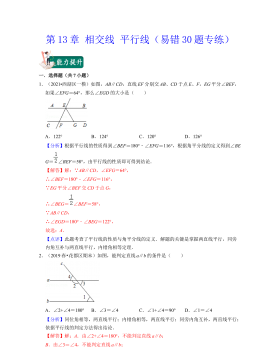 2024-10-14 28
 -
七年级数学下册(易错30题专练)(沪教版)-第12章 实数(原卷版)VIP免费
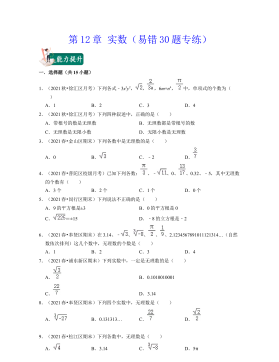 2024-10-14 27
 -
七年级数学下册(易错30题专练)(沪教版)-第12章 实数(解析版)VIP免费
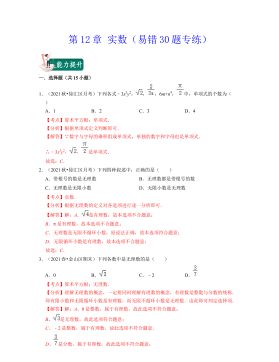 2024-10-14 19
 -
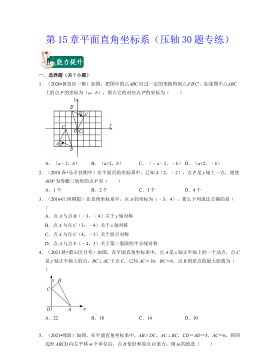
七年级数学下册(压轴30题专练)(沪教版)-第15章平面直角坐标系(原卷版)VIP免费
 2024-10-14 19
 -
七年级数学下册(压轴30题专练)(沪教版)-第15章平面直角坐标系(解析版)VIP免费
 2024-10-14 27
 -
七年级数学下册(压轴30题专练)(沪教版)-第14章三角形(原卷版)VIP免费
 2024-10-14 19
 -
七年级数学下册(压轴30题专练)(沪教版)-第14章三角形(解析版)VIP免费
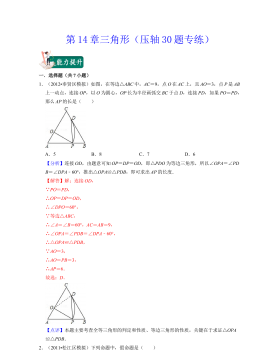 2024-10-14 30
 -
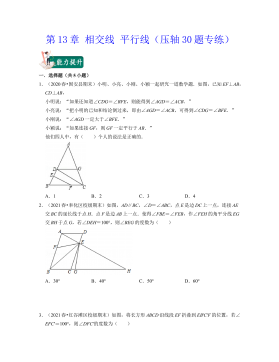
七年级数学下册(压轴30题专练)(沪教版)-第13章 相交线 平行线(原卷版)VIP免费
 2024-10-14 26
 -
七年级数学下册(压轴30题专练)(沪教版)-第13章 相交线 平行线(解析版)VIP免费
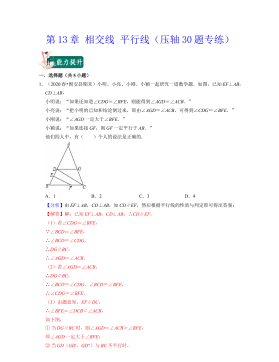 2024-10-14 22
作者:周伟光
分类:高等教育资料
价格:15积分
属性:49 页
大小:669.65KB
格式:PDF
时间:2024-09-30


相关内容
-
七年级数学下册(压轴30题专练)(沪教版)-第15章平面直角坐标系(解析版)
分类:中小学教育资料
时间:2024-10-14
标签:无
格式:DOCX
价格:15 积分
-
七年级数学下册(压轴30题专练)(沪教版)-第14章三角形(原卷版)
分类:中小学教育资料
时间:2024-10-14
标签:无
格式:DOCX
价格:15 积分
-
七年级数学下册(压轴30题专练)(沪教版)-第14章三角形(解析版)
分类:中小学教育资料
时间:2024-10-14
标签:无
格式:DOCX
价格:15 积分
-
七年级数学下册(压轴30题专练)(沪教版)-第13章 相交线 平行线(原卷版)
分类:中小学教育资料
时间:2024-10-14
标签:无
格式:DOCX
价格:15 积分
-
七年级数学下册(压轴30题专练)(沪教版)-第13章 相交线 平行线(解析版)
分类:中小学教育资料
时间:2024-10-14
标签:无
格式:DOCX
价格:15 积分